While working on my app, I noticed a discrepancy in performance between the deployed version and my local environment. There was a little delay to display some information, that I found annoying.
In this blog post, I’ll walk you through how I quickly enhanced my app’s performance by analyzing Dash callback execution, which hopefully give you some ideas for your debugging too. 🙂
Context
My dash application is essentially a real estate map which displays information when clicking on map points.
The click that displayed information felt instant when running locally, but when running in production, it had about a one-second delay. I also noticed that the more elements I displayed on my map, the worse the performance became.
My production app and local app differ in some ways, and I could imagine at least two reasons:
- Maybe callbacks are slower due to design differences between production and local development. For example, the cache used is not the same: I use Flask cache disk locally, which is faster, while my app uses a Redis backend to cache results. Redis introduces additional overhead due to the external request it must handle, compared to just RAM or disk caching on the same device.
- Maybe the request itself is slower due to upload/download speed limits. When deployed, my app is on a remote web server, whereas locally it runs directly on my computer. Obviously, this introduces extra overhead. It’s much faster for my browser to communicate with a local app on the same device as with a remote app over the internet.
So how to debug this?
To make it short, I tried to replicate the issue locally (which is always a good way to debug things). I started by inspecting the triggered callbacks after a click on the map. You might know that all Dash callbacks translate to HTTP requests, so I used the developer tools and network tab to analyze what was happening.
If you don’t know that callbacks translate to HTTP request, I recommend you to download my guide “Master Dash Callbacks: Architecture & Best Practices (Free PDF)” 😉 find it on the sidebar —-> or below this article on mobile.
To simulate a “distant” request from my computer to a remote server, I set the network throttling to “Good 3G” to mimic a 3G mobile connection. This was key in debugging. Without this, everything appeared snappy in my browser.
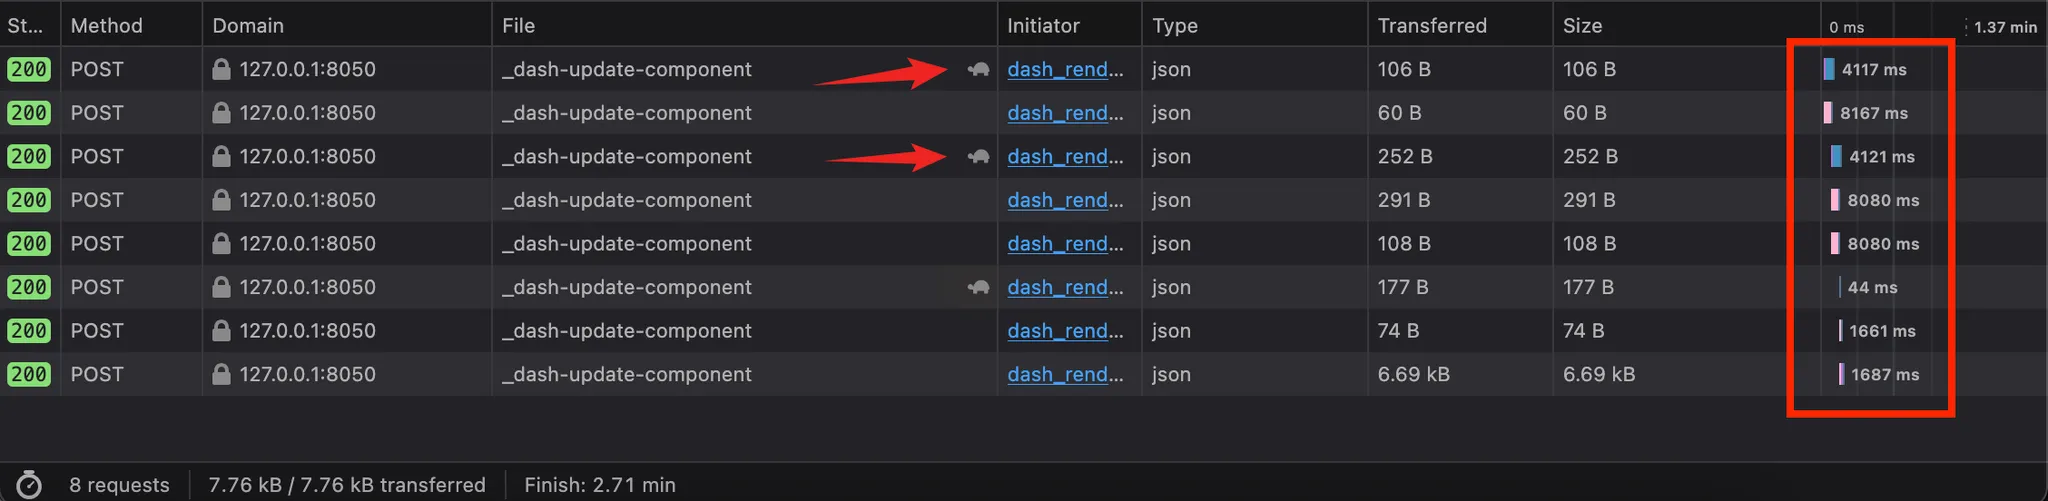
I discovered that eight callbacks were triggered (directly or indirectly) after clicking on the map. Here is the debugging process in video:
As you can see in the video, it literally took around 14 seconds (!!) to complete the eight callbacks after clicking on the map.
Two requests appeared to be blocking the others, leading to huge delays: between 1 and 8 seconds for some callbacks. This is significant.
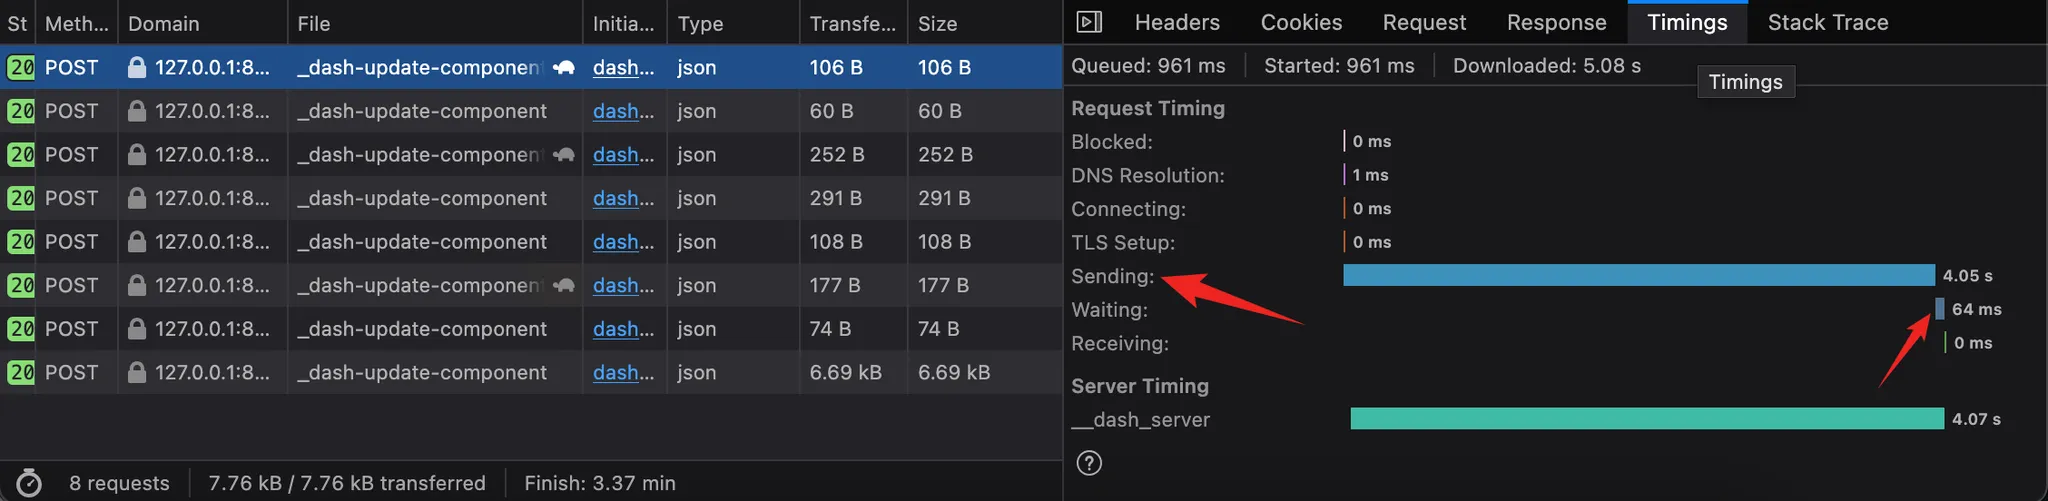
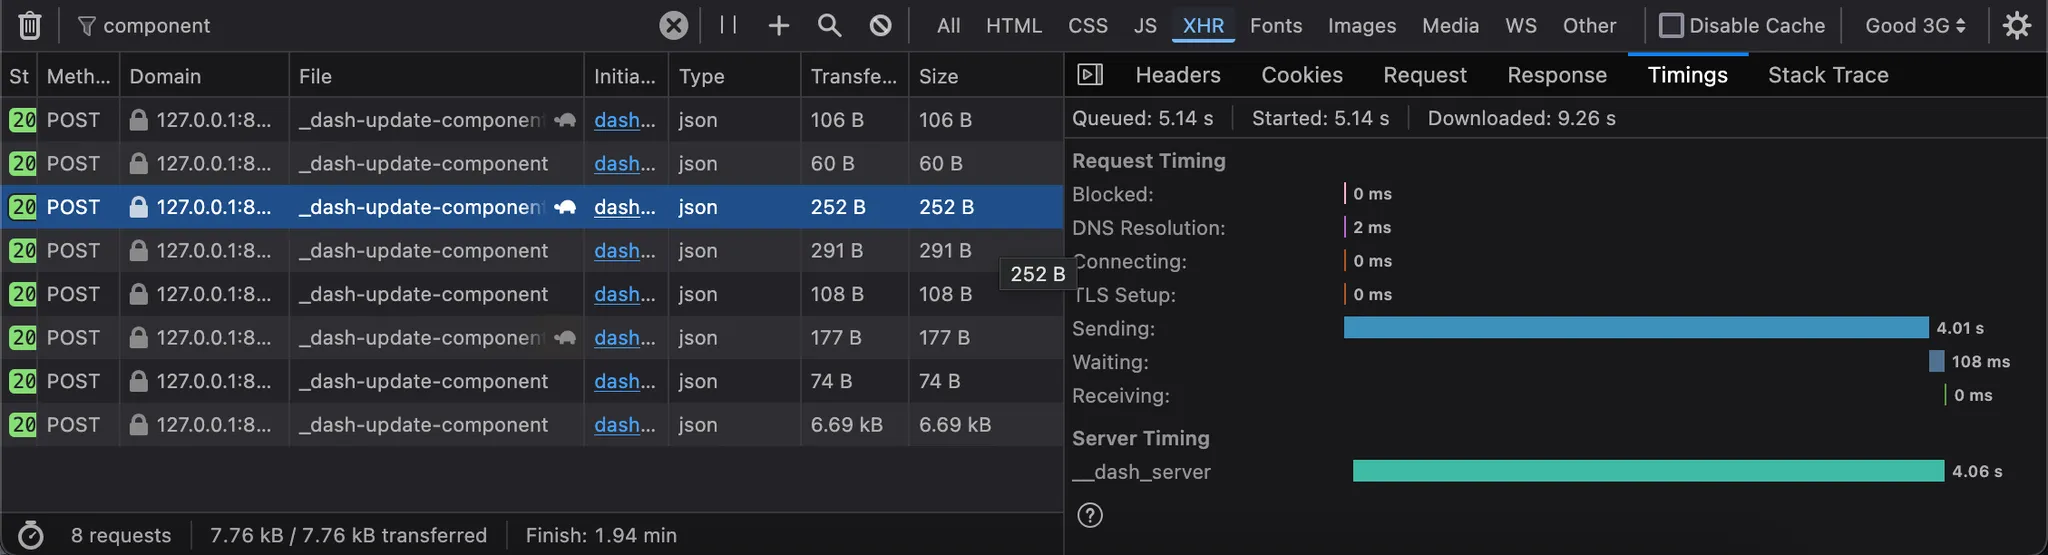
When inspecting the first request, I quickly realized that the bottleneck was the time spent “Sending” the data: 4.05s. The “Waiting” time (when the browser waits for the server response) was only 64ms. So, the callback processing was not the problem—the data upload was.
When inspecting the second request, I saw that it was also blocked for 4.05s, meaning it was simply not triggered immediately.
The third request showed the same problem as the first one: too much time spent sending data, with only 108ms processing on the server side and no delay in receiving the result.
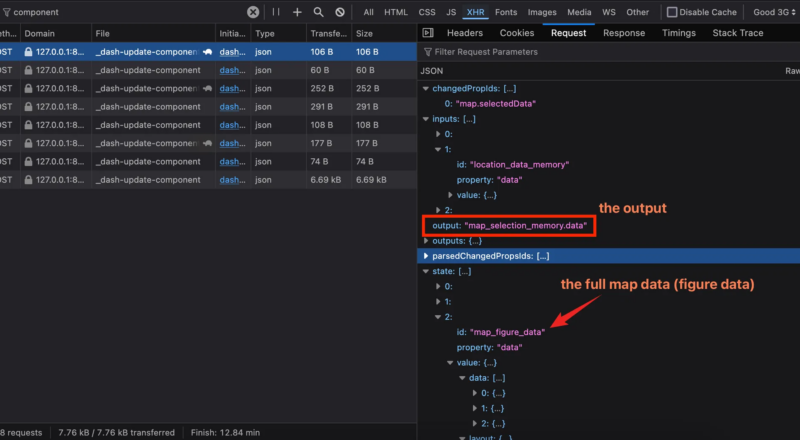
At this point, it was clear that two callbacks were problematic. To identify which callbacks these HTTP requests were triggering, I inspected the request details. The names of outputs, inputs, and states are visible as part of the information Dash sends with each callback:
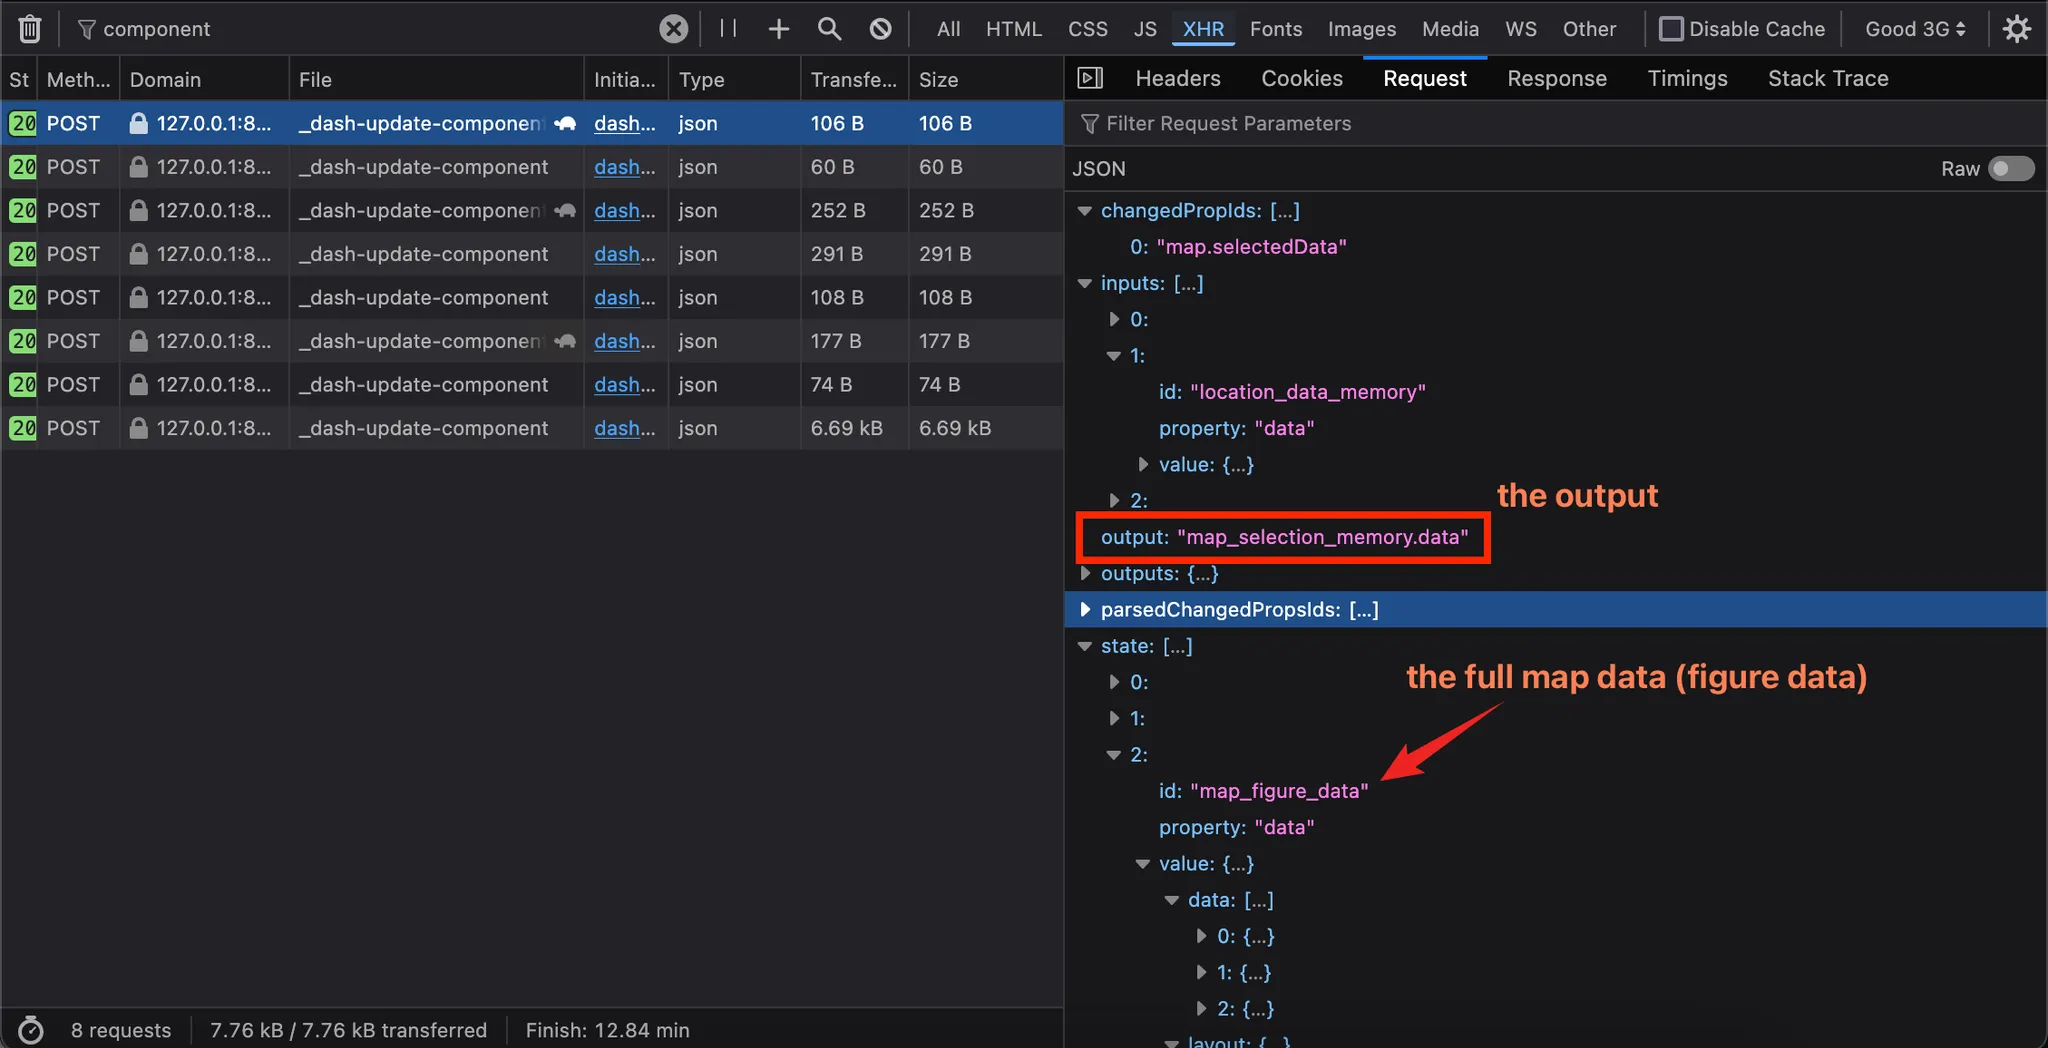
I realized that the full map data (map_figure_data) was being sent. For my app, that meant all the points and their hover information (descriptions, images, etc.).
Even though it wasn’t a huge amount of data, it posed two problems:
- Upload speeds are usually slower than download speeds. For slow connections like mobile networks, this delay is unbearable.
- The issue worsens as the number of data points on my map increases (!)
The second callback had the same problem. This time, the map data was an input. The goal was to see how I could eliminate this map_figure_data dependency.
Resolution
I then looked at my two callbacks. Here’s what they originally looked like.
callback 1 – before
@callback(
    Output("map_selection_memory", "data"),
    [
        Input("map", "selectedData"),
        Input("location_data_memory", "data"),
        Input("layer_selection_memory", "data"),
    ],
    [
        State("map_curve_mapping_memory", "data"),
        State("map_selection_memory", "data"),
        State("map_figure_data", "data"),  # the problematic state
    ]
)
def store_map_selection(
    selected_data, location_data, layer, curve_mapping, selected_ids, figure_data
):
    """A callback that Stores the selected ids in memory."""
While reviewing the callback code, I realized that figure_data wasn’t even used. So, I removed it and it solved the problem for this callback… (yes, I guess that these things happens!).
callback 1 – after (removed useless state!)
@callback(
    Output("map_selection_memory", "data"),
    [
        Input("map", "selectedData"),
        Input("location_data_memory", "data"),
        Input("layer_selection_memory", "data"),
    ],
    [
        State("map_curve_mapping_memory", "data"),
        State("map_selection_memory", "data"),
        # just removed the useless state
    ]
)
def store_map_selection(
    selected_data, location_data, layer, curve_mapping, selected_ids
):
    """A callback that Stores the selected ids in memory."""
Now, looking at the second callback.
callback 2 – before
@callback(
    Output("cache_data_metadata_memory", "data"),
    [
        Input("map_figure_data", "data"),  # this is problematic
        Input("map_selection_memory", "data"),
        Input("data_modal_unchecked_memory", "data"),
    ],
    State("address_input_memory", "data"),
    State("layer_selection_memory", "data"),
    State("filters_selection_memory", "data"),
    prevent_initial_call=True,
)
def update_cache_data_metadata_memory(
    fig_data, selected_ids, unchecked_ids, address, layer, filters
):
    """Update metadata dict (...)"""
Again, fig_data wasn’t used. However, I still needed map_figure_data to trigger updates, so I changed the input property to modified_timestamp. This enables the callback to be triggered when map_figure_data changes (its timestamp is updated) while not transferring the whole data.
callback 2 – after (changed to modified_timestamp)
@callback(
    Output("cache_data_metadata_memory", "data"),
    [
        Input("map_figure_data", "modified_timestamp"),  # this is efficient
        Input("map_selection_memory", "data"),
        Input("data_modal_unchecked_memory", "data"),
    ],
    State("address_input_memory", "data"),
    State("layer_selection_memory", "data"),
    State("filters_selection_memory", "data"),
    prevent_initial_call=True,
)
def update_cache_data_metadata_memory(
    map_update_timestamp, selected_ids, unchecked_ids, address, layer, filters
):
    """Update metadata dict (...)"""
And that did the job perfectly!
But what if I actually had to keep the full figure data ? I would have had two choices:
- Create another input, that is lighter than the figure data
- Process the figure data in a clientside callback to avoid a roundtrip to the server.
Result
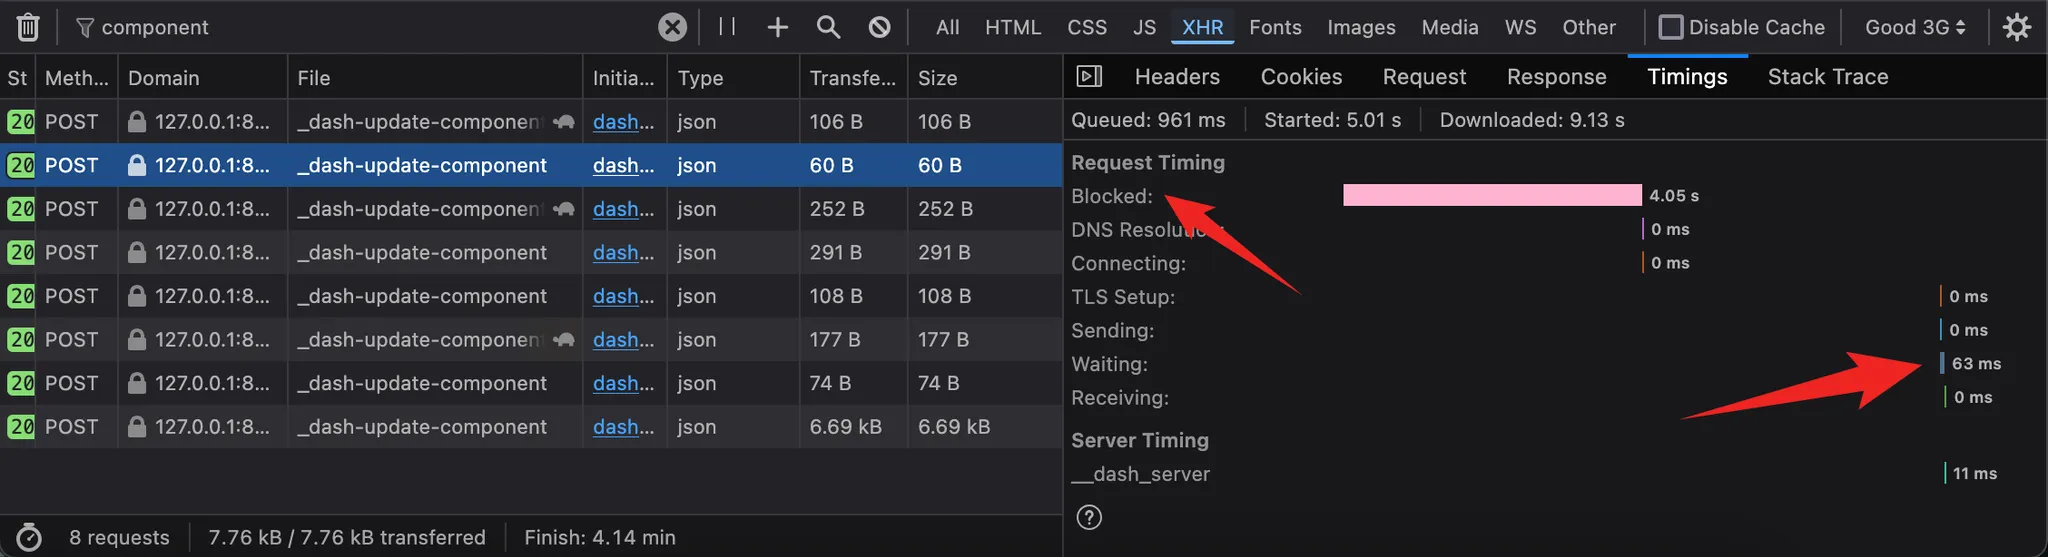
These changes literally took 20 seconds to implement. The result was instantly better, even with the “Good 3G” mobile throttling still enabled:
After making these adjustments, I ensured there were no other instances of map_figure_data being used as either an Input or Output.
Conclusion
When debugging this issue, I thought it would be an interesting use case to share, because:
- Using developer tools is a powerful way to debug slow callbacks and sluggish Dash apps. Keep in mind that all inputs and states trigger data uploads, which in some cases can be extremely slow.
- Using throttling mode allows you to simulate production conditions or at least non-optimal conditions, unlike debugging locally.
I hope you found this interesting. Such performance explanations and debugging techniques are part of my Dash course, where you can find more detailed explanations and videos.
If you have questions, feel free to ask them here on Plotly’s forum.
Happy coding! ⭐