Dash Plotly Course :
Fundamentals to Advanced
Master the art of building powerful web applications with Dash Plotly
from dashboards to full-featured interactive web applications, 100% in Python. ⭐
⬇️ Here is what you will learn to build ⬇️
About this course
Dash Resources – Level 1: Fundamentals to Advanced is your complete, hands-on guide to building and deploying interactive data web applications with Python and Dash.
Whether you’re a data analyst tired of static reports, a data scientist who wants to share models interactively, or a Python developer looking to build full-stack apps without learning JavaScript ; this course was made for you.
What you’ll build
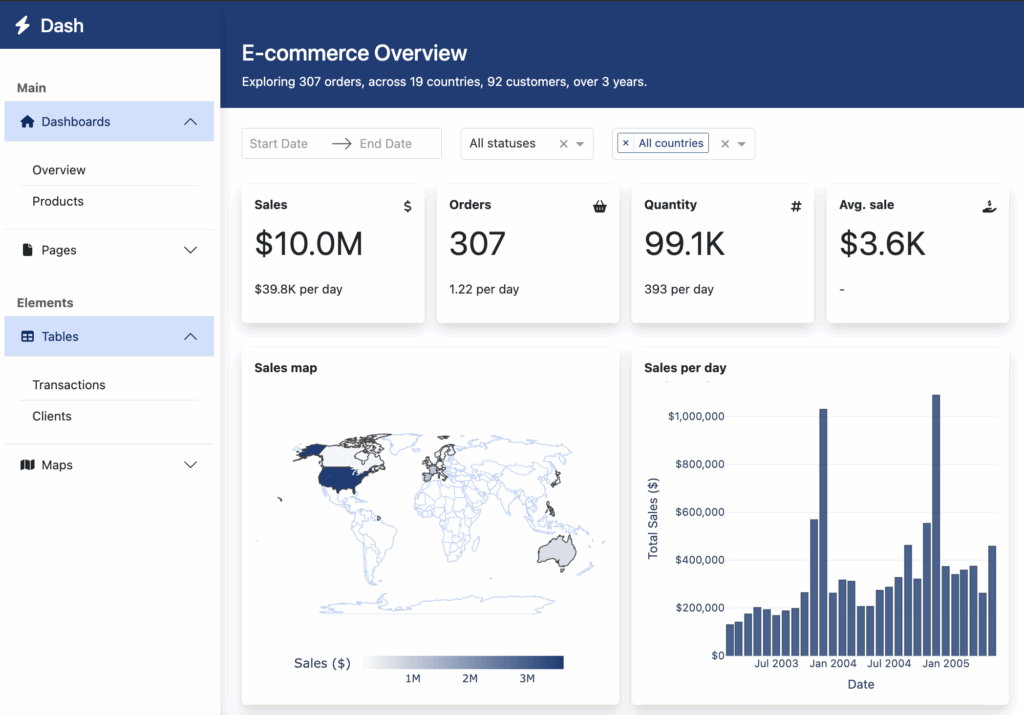
From the very first chapter, you’ll work toward a single goal: a fully deployed, multi-page e-commerce dashboard. You’ll start from a blank Python file and finish with a live web application featuring interactive KPI cards, a world sales map, time-series charts, filterable AG Grid tables, Excel data export, and URL-driven navigation between pages … all accessible from a public URL on the internet.
What you’ll learn
The course is structured in three parts:
- Fundamentals: Learn how Dash works from the ground up: components (HTML, Dash Core, Dash Bootstrap), callbacks (Input, Output, State), and how to structure a scalable project using the MVC pattern.
- Basic Dashboard: Build a real dashboard step by step: design the layout, wire interactive filters, create Plotly charts (bar, pie, choropleth map), display KPIs, and add data tables.
- Advanced Dash app: Level up with multi-page routing, parametrized URLs, AG Grid dynamic tables, browser-side data persistence with dcc.Store, data export, pattern-matching callbacks, clientside callbacks, and finally cloud deployment with Fly.io and Docker.
Why Dash?
Unlike Tableau or Power BI, Dash gives you full control over your data, your UI, your logic, and your infrastructure. It runs on standard Python, integrates seamlessly with pandas and Plotly, and can be deployed just like any other web application. Some developers even use it to build and sell their own SaaS products (I do!)
Why take a course when I can just ask AI?
AI can generate a working Dash app in seconds, but when it breaks, you need real knowledge to fix it. Without understanding the fundamentals, you end up going in circles, asking the AI to patch problems it created. Callbacks alone can become an unmaintainable mess without the right mental model.
-> AI is a great accelerator, but a poor foundation. Learn the basics first, and AI becomes a genuine 10× tool rather than a crutch. 😉
Course Overview
1. Fundamentals
Learn the core concepts and basics of Dash.
- About this course
- Discover what Dash Plotly is, why it’s a powerful choice for building data apps, and how to use this course effectively.
- Getting started
- Set up Python, create a virtual environment, install Dash dependencies, and run your very first Dash app.
- Components
- Explore the three UI building blocks: HTML components, Dash Core Components, and Dash Bootstrap Components, and learn when to use each one.”
- Callbacks
- Connect components with Input, Output, and State, handle multiple callbacks, chain them together, and control execution with PreventUpdate.
- Project structure
- Organize your Dash project with the MVC pattern, splitting layouts, callbacks, and utilities into dedicated folders for clean, scalable code.
2. Basic Dashboard
Build your first interactive dashboard.
- Getting inspiration
- Explore design templates, learn common dashboard patterns, and discover the e-commerce dataset used throughout the rest of the course.
- App Layout
- “Learn the row-and-column system and build the dashboard skeleton with a sidebar and main content area using Dash Bootstrap Components.
- Sidebar layout
- Build a navigation sidebar with DBC Accordion, ListGroup, Font Awesome icons, and Bootstrap utility classes.
- Main layout and filters
- Write data utility functions, then build a header with date picker and dropdown filters, polished with custom CSS.
- Interactive KPIs
- Build four KPI cards, connect them to the filters via callbacks, and format raw numbers into readable values with a reusable utility function.
- Introduction to Plotly charts
- Learn Plotly’s Figure, Trace, and Layout concepts, compare Plotly Express vs Graph Objects, and create your first interactive charts.
- Map & price charts
- Build a choropleth sales map, a monthly bar chart, and a deal-size pie chart, then connect them all to the existing filter callbacks.
- Static tables
- Compare four table approaches in Dash, implement a styled DBC table from a DataFrame, and understand its styling and performance limitations.
3. Advanced Dash app
Learn advanced Dash features and deploy your app.
- Multi pages app
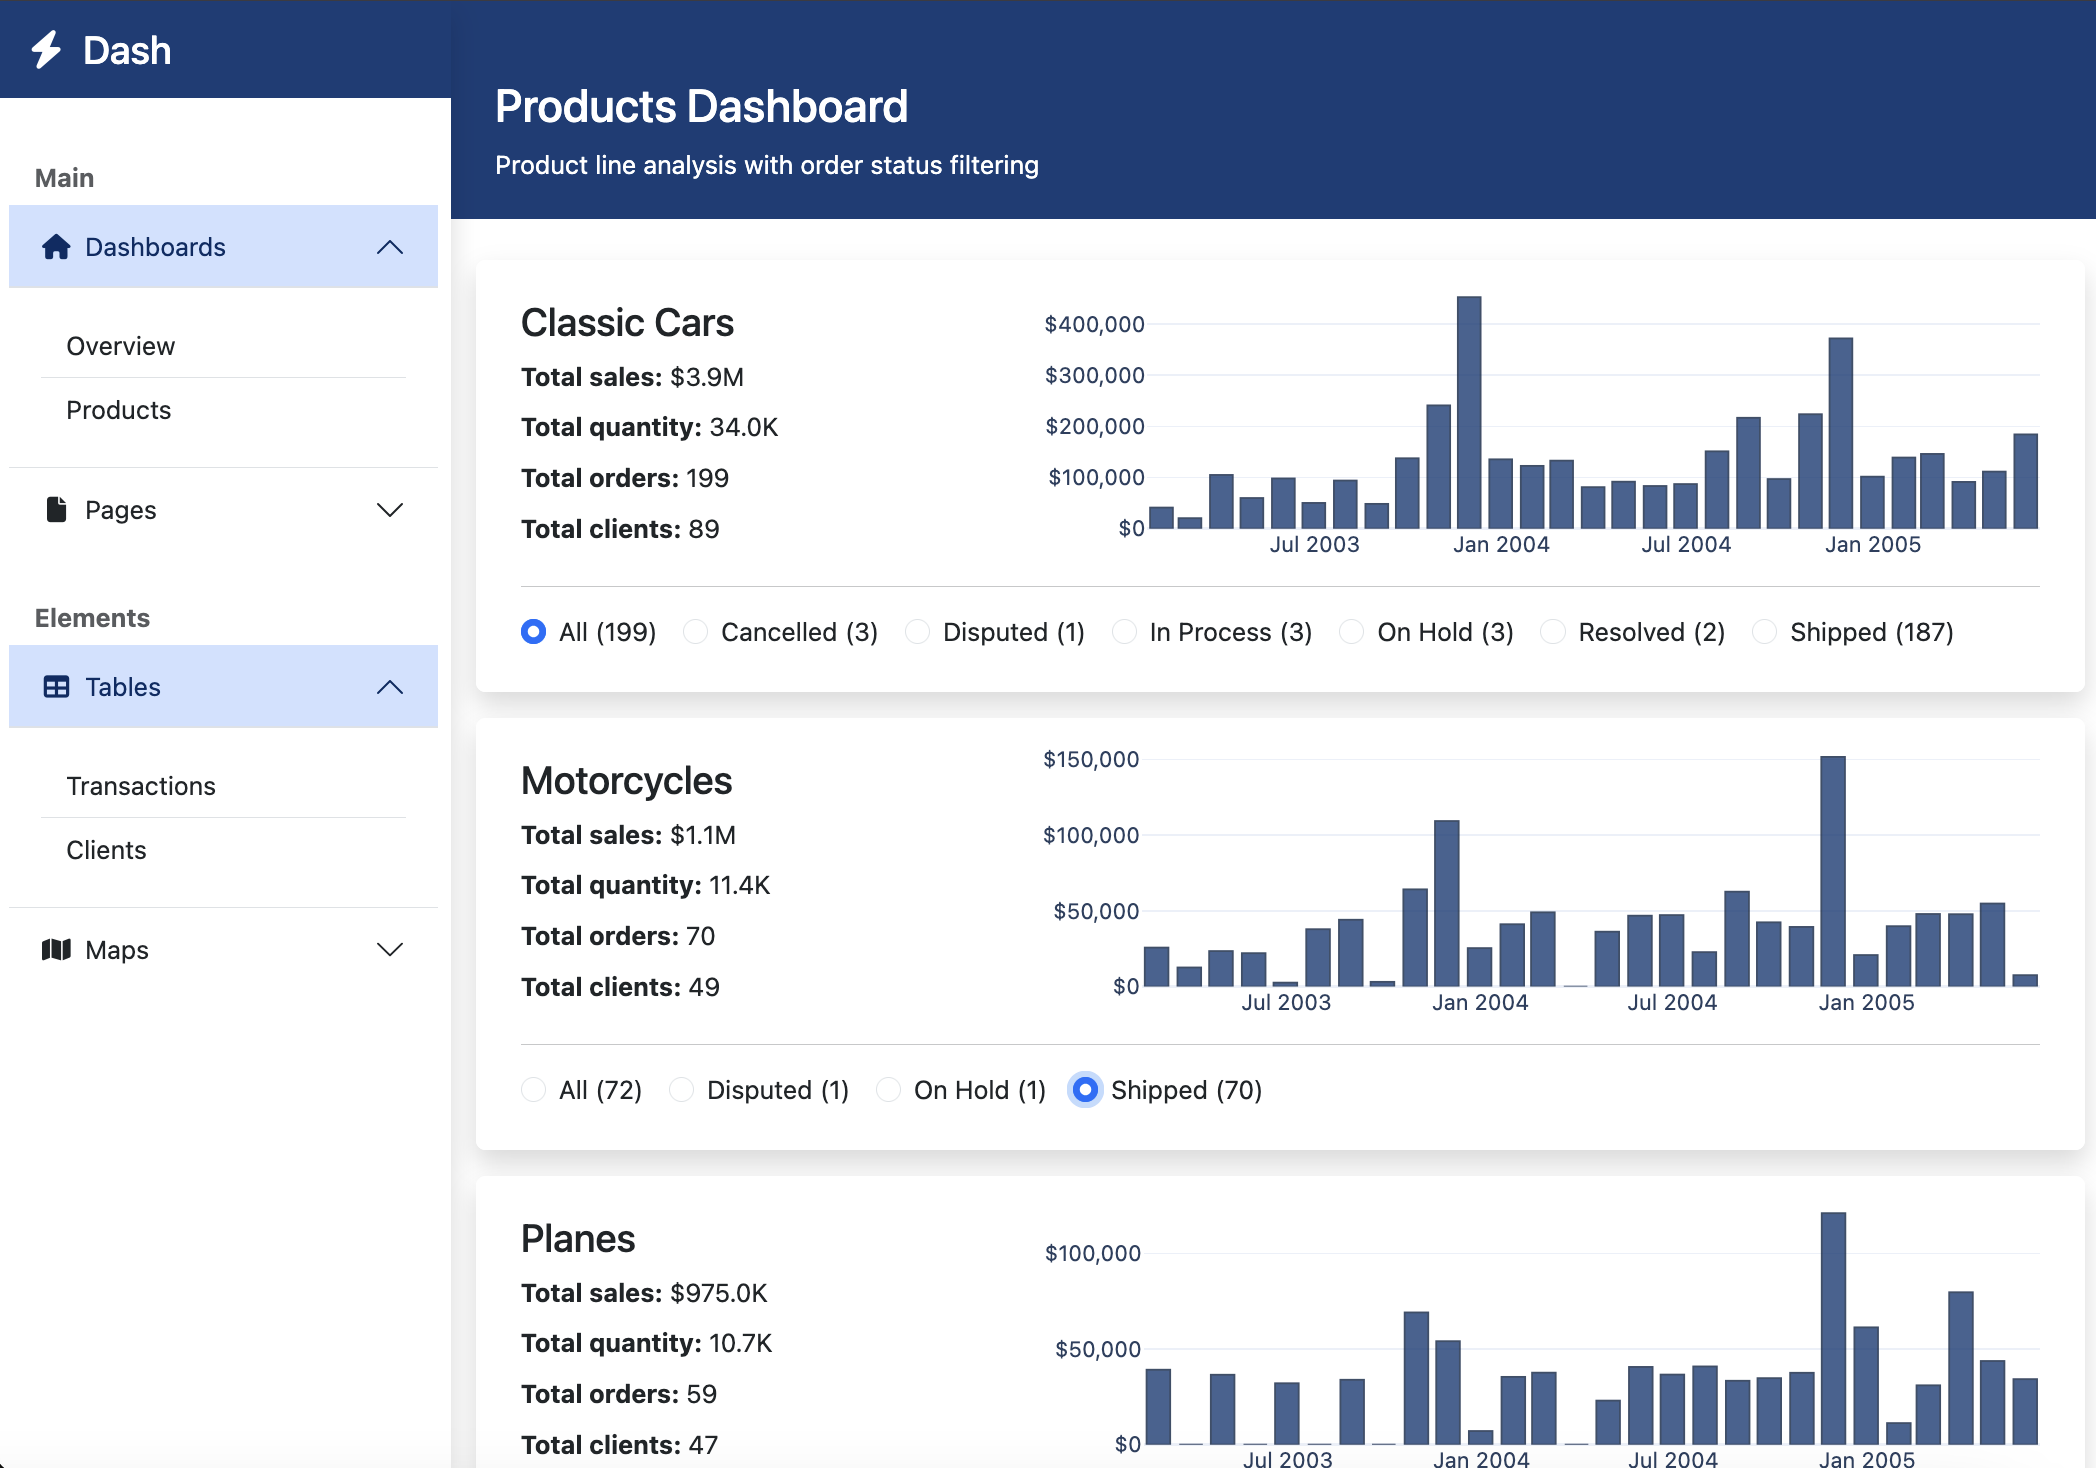
- Turn the dashboard into a multi-page app using Dash page routing, with dedicated pages for each section and a custom 404 page.
- Parametrized URLs
- Use URL path templates and query strings to load dynamic page content, such as a single-order detail page at /orders/<order_id>.
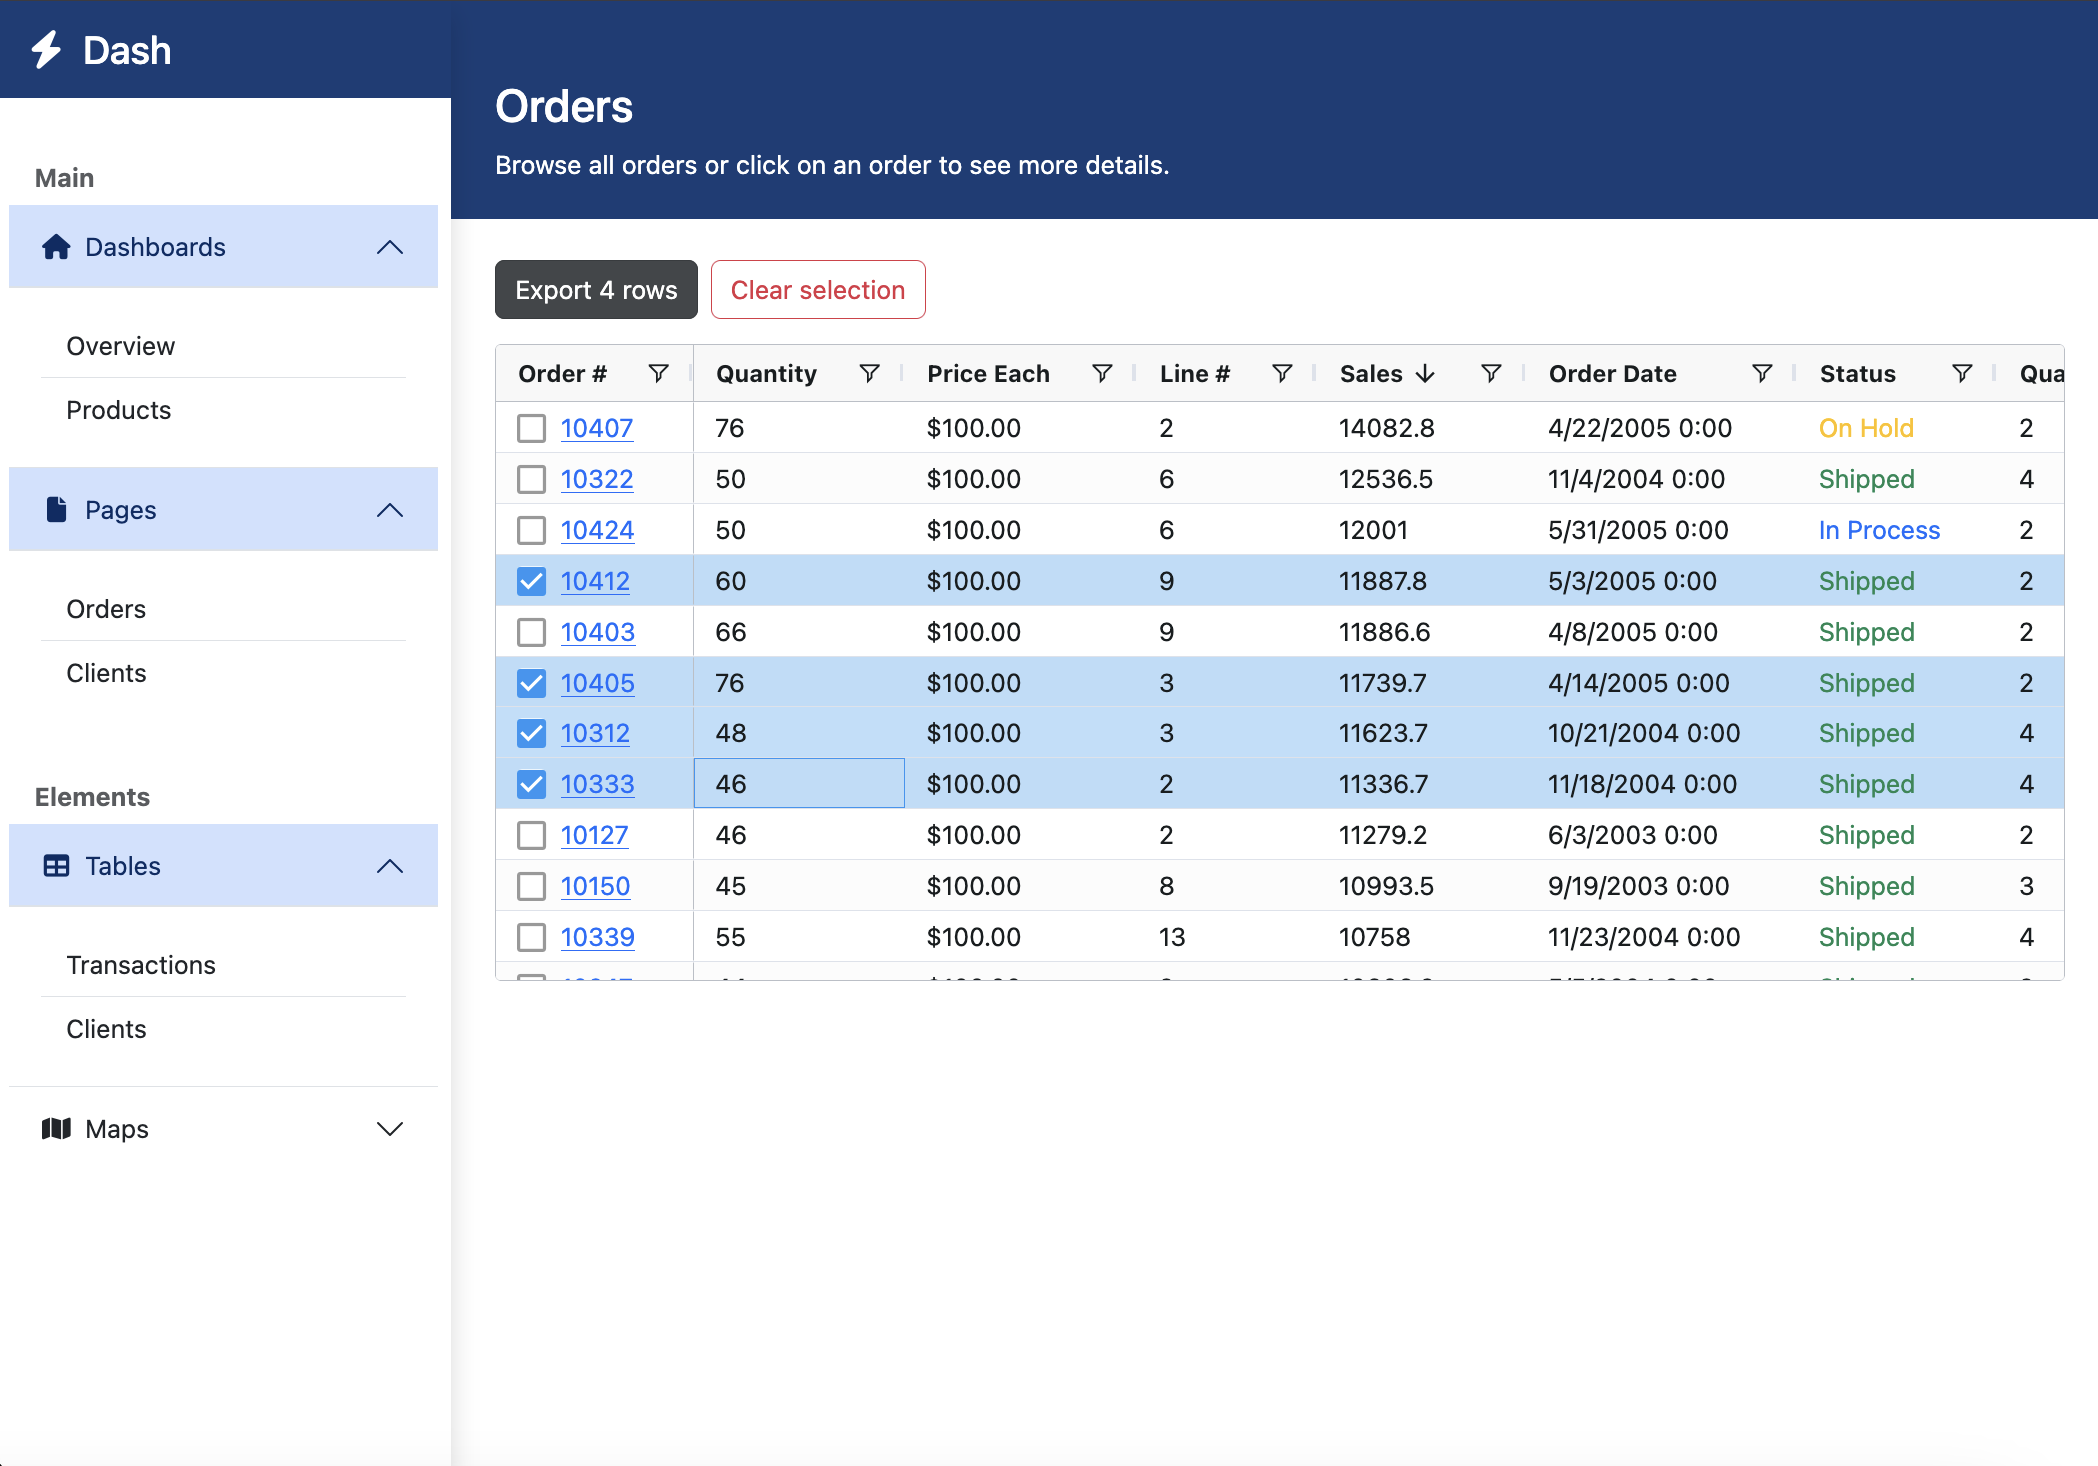
- Dynamic Tables with AG Grid
- Integrate AG Grid with column definitions, theming, virtualization, value formatters, and conditional cell styling for professional tables.
- Persistence and dcc.Store
- Persist state across page changes using component persistence and dcc.Store with memory, session, and local browser storage types.
- Exporting data
- Let users select AG Grid rows and download them as an Excel file via dcc.Download, with dynamic button feedback powered by chained callbacks.
- Pattern-matching callbacks
- Use MATCH and ALL wildcards to write one callback that handles any number of dynamically generated components, eliminating repetitive code.
- Clientside callbacks
- Learn how callbacks trigger HTTP round-trips, when to use JavaScript clientside callbacks for faster interactions, and their performance trade-offs.
- Deployment
- Learn about stateless apps and WSGI servers, then deploy the Dash app to the cloud using Fly.io with Gunicorn and a Dockerfile.
All chapters of the course come with
📕 text explanation, 🎥 video and 💪 practice session.
3h+ of video / 4 days of learning material
Ready ?
Who is this course for?
Data Professionals
Data professionals that want to extend their skills into building data platforms.
Developers
Developers that want to build web apps 100% in Python ; no React, Angular, or VueJS skills required.
Course Benefits
About your instructor

François (Fran)
A data-focused web developer with 10+ years of experience, I’ve been crafting production-ready Dash Plotly applications for the past 4 years. Former Data Scientist and OpenClassrooms mentor, I combine deep technical knowledge with proven teaching skills to help you master both data visualization and web development. Learn more here!
Any question on the course ? Send me a message here.