Dash and Streamlit are two Python frameworks that can be used to build data applications and interactive dashboards. But what makes them different? And which one should you pick for your projects?
You will find in this article a short description of both frameworks and two code examples of use cases that suit the former and the latter. At the end, we summarize the comparison for Dash vs. Streamlit in comprehensive tables. Let’s dive in!
TL;DR: Streamlit is very good for building tools, Dash is very good for building apps.
About Streamlit
Streamlit, is designed for creating data apps with minimal effort, focusing on simplicity and fast development cycles. Its key strengths are:
- Fast prototyping of data applications
- Simple, declarative syntax that follows a linear execution flow
- Built-in widgets and layout components
- Automatic reactivity – the entire app reruns on any user interaction
- Effortless deployment through Streamlit Cloud
Example: Streamlit is an excellent choice if you want to quickly transform a Jupyter notebook into an interactive web application or create internal tools for data exploration without spending time on frontend development.
Streamlit has grown significantly in popularity due to its simplicity and ease of use. It’s worth mentioning that deploying a Streamlit app and making it accessible on the internet is super easy with Streamlit Cloud (just a few clicks).
About Dash
Dash Plotly, on the other hand, is specifically designed for building analytical web applications and data visualization dashboards. Its key strengths are:
- Creating interactive web applications 100% in Python
- Real-time data updates and callbacks
- Deep integration with Plotly’s visualization library
- Building data-heavy applications for data scientists and analysts
- Highly customizable layouts and components
Example: Dash is an excellent choice if want to build a data web application that requires complex interactions between components or if you need pixel-perfect control over your visualizations, such as financial analytics platforms or enterprise-grade dashboards.
Dash is a growing framework with a vibrant community. Recent updates have expanded Dash beyond just data visualization, moving towards becoming a more complete Python web framework with features like built-in URL routing, authentication, and advanced component libraries. This evolution makes Dash increasingly suitable for building full-featured web applications entirely in Python.
Code comparison
I assume that if you read this, you are somehow familiar with Python 😉. So let’s take a look at some tangible examples, with code. That will be much more illustrative.
Where Streamlit is better
Streamlit truly shines in its simplicity and speed of development. Here’s how easy it is to create a simple data app:
###### STREAMLIT EXAMPLE ######
import streamlit as st
import pandas as pd
import plotly.express as px

st.title("Simple Data Explorer")

# Load data
uploaded_file = st.file_uploader("Upload CSV", type=['csv'])
if uploaded_file:
    df = pd.read_csv(uploaded_file)

# Simple controls
    x_column = st.selectbox("X axis", df.columns)
    y_column = st.selectbox("Y axis", df.columns)

# Create and display plot
    fig = px.scatter(df, x=x_column, y=y_column)
    st.plotly_chart(fig)

# Show data summary
    st.write("Data Summary:", df.describe())


# If you want to run this example, open the terminal and:
# pip install streamlit pandas plotly
# streamlit run streamlit_app.py
This concise code creates a complete app with file uploading, interactive controls, visualization, and data summary:
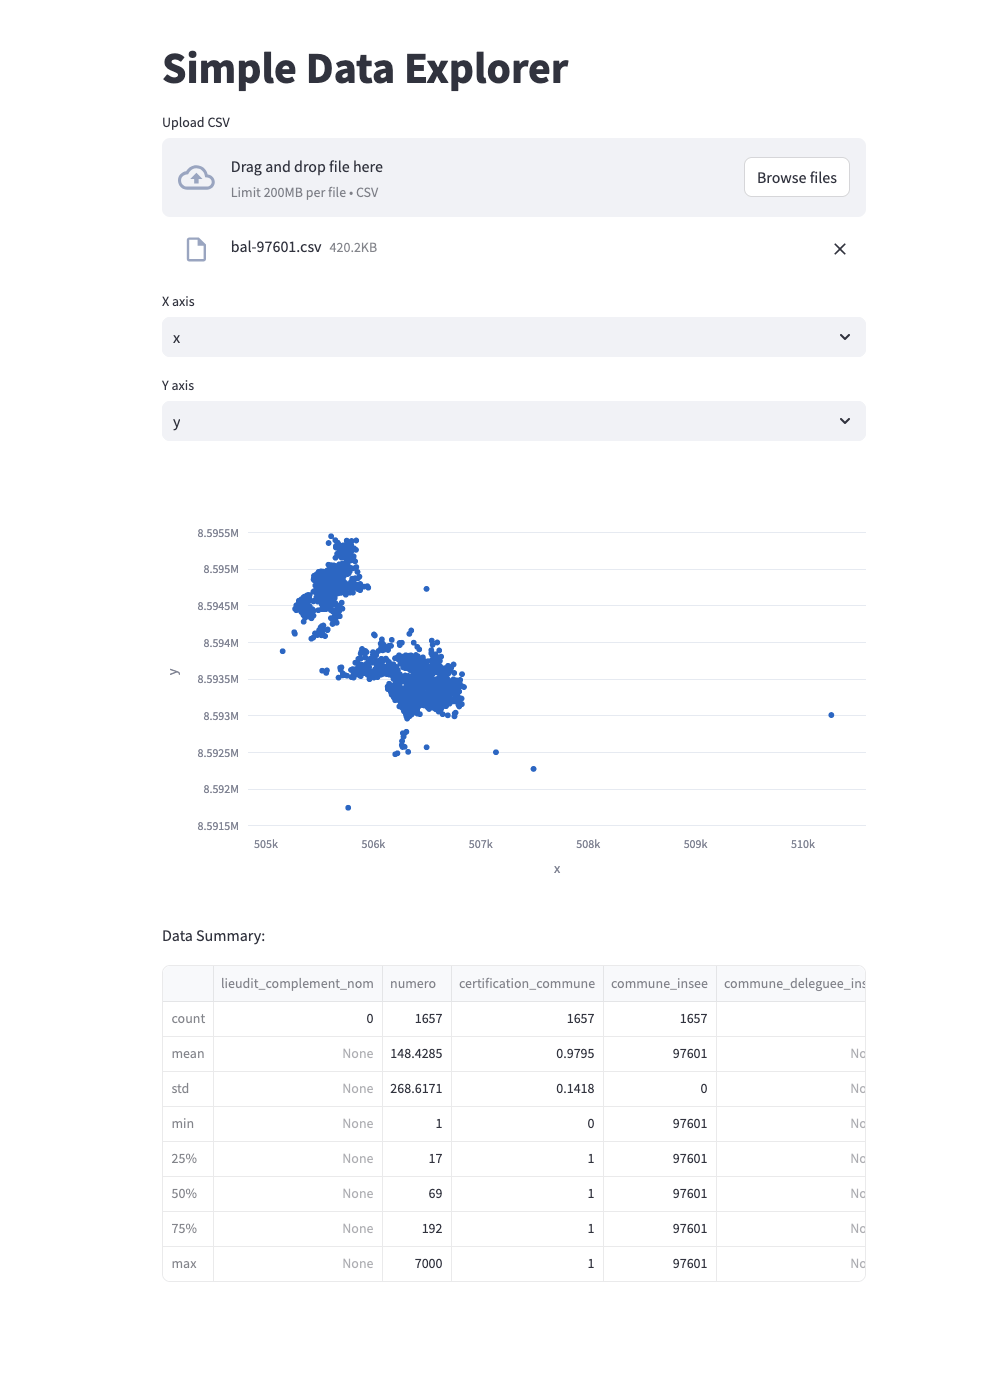
To be honest, how straightforward and readable is this code is blows my mind 🤯. That’s difficult to do simpler, well done Streamlit!
Each line does exactly one thing: getting data from the user (reading the file, or the dropdown input) or udpating a visual (chart or table). One thing is handled by one function, keeping things clear and easy to understand.
Now let’s see the equivalent in Dash:
###### DASH EQUIVALENT ######
import io
import pandas as pd
import plotly.express as px
import base64
import dash_bootstrap_components as dbc
from dash import Dash, dcc, html, Input, Output, State, no_update

app = Dash(
    __name__,
    external_stylesheets=[dbc.themes.BOOTSTRAP],
    suppress_callback_exceptions=True
)

# Custom CSS for the upload component
upload_style = {
    'width': '100%',
    'height': '60px',
    'lineHeight': '60px',
    'borderWidth': '1px',
    'borderStyle': 'dashed',
    'borderRadius': '5px',
    'textAlign': 'center',
    'margin': '10px 0',
    'backgroundColor': '#fafafa',
    'cursor': 'pointer',
    'transition': 'border .24s ease-in-out',
}

# Define the full layout upfront
app.layout = dbc.Container([
    html.H1("Simple Data Explorer", className="text-center my-4"),

    # Upload component
    dcc.Upload(
        id='upload-data',
        children=html.Div([
            'Drag and Drop or ',
            html.A('Select CSV', className="text-primary")
        ]),
        style=upload_style,
        multiple=False
    ),

    # Store for the dataframe
    dcc.Store(id='dataframe', storage_type='memory'),

    # Analysis section (hidden by default)
    dbc.Container([
        dbc.Row([
            dbc.Col([
                html.Label("X axis:", className="mt-3"),
                dcc.Dropdown(id='x-column', options=[], value=None),
                html.Label("Y axis:", className="mt-3"),
                dcc.Dropdown(id='y-column', options=[], value=None),
            ], width=12)
        ]),

        html.Div(id='graph-container', className="my-4"),

        html.H3("Data Summary", className="mt-4"),
        html.Div(id='data-summary')
    ], id='analysis-container', style={'display': 'none'})

], fluid=False, style={'maxWidth': '800px'})

@app.callback(
    [Output('dataframe', 'data'),
     Output('analysis-container', 'style'),
     Output('x-column', 'options'),
     Output('y-column', 'options')],
    Input('upload-data', 'contents'),
    State('upload-data', 'filename')
)
def process_upload(contents, filename):
    if contents is None:
        return None, {'display': 'none'}, [], []

    # Decode the base64 encoded content
    content_type, content_string = contents.split(',')
    decoded = base64.b64decode(content_string)

    try:
        # Read the CSV file
        df = pd.read_csv(io.StringIO(decoded.decode('utf-8')), sep=";")
        options = [{'label': i, 'value': i} for i in df.columns]
        return (
            df.to_json(),
            {'display': 'block'},
            options,
            options
        )
    except Exception as e:
        return None, {'display': 'none'}, [], []

@app.callback(
    Output('data-summary', 'children'),
    Input('dataframe', 'data')
)
def update_summary(json_data):
    if not json_data:
        return no_update

    df = pd.read_json(json_data)
    return dbc.Table.from_dataframe(
        df.describe().reset_index(),
        striped=True,
        bordered=True,
        hover=True,
        responsive=True
    )

@app.callback(
    Output('graph-container', 'children'),
    [Input('x-column', 'value'),
     Input('y-column', 'value'),
     Input('dataframe', 'data')]
)
def update_graph(x_col, y_col, json_data):
    if not json_data or not x_col or not y_col:
        return html.Div("Please select X and Y columns")

    df = pd.read_json(json_data)
    fig = px.scatter(df, x=x_col, y=y_col)
    return dcc.Graph(figure=fig)

if __name__ == '__main__':
    app.run_server(debug=True)

# If you want to run the app, do:
# pip install dash dash-bootstrap-components pandas plotly
# python dash_app.py
Which is giving the following app:
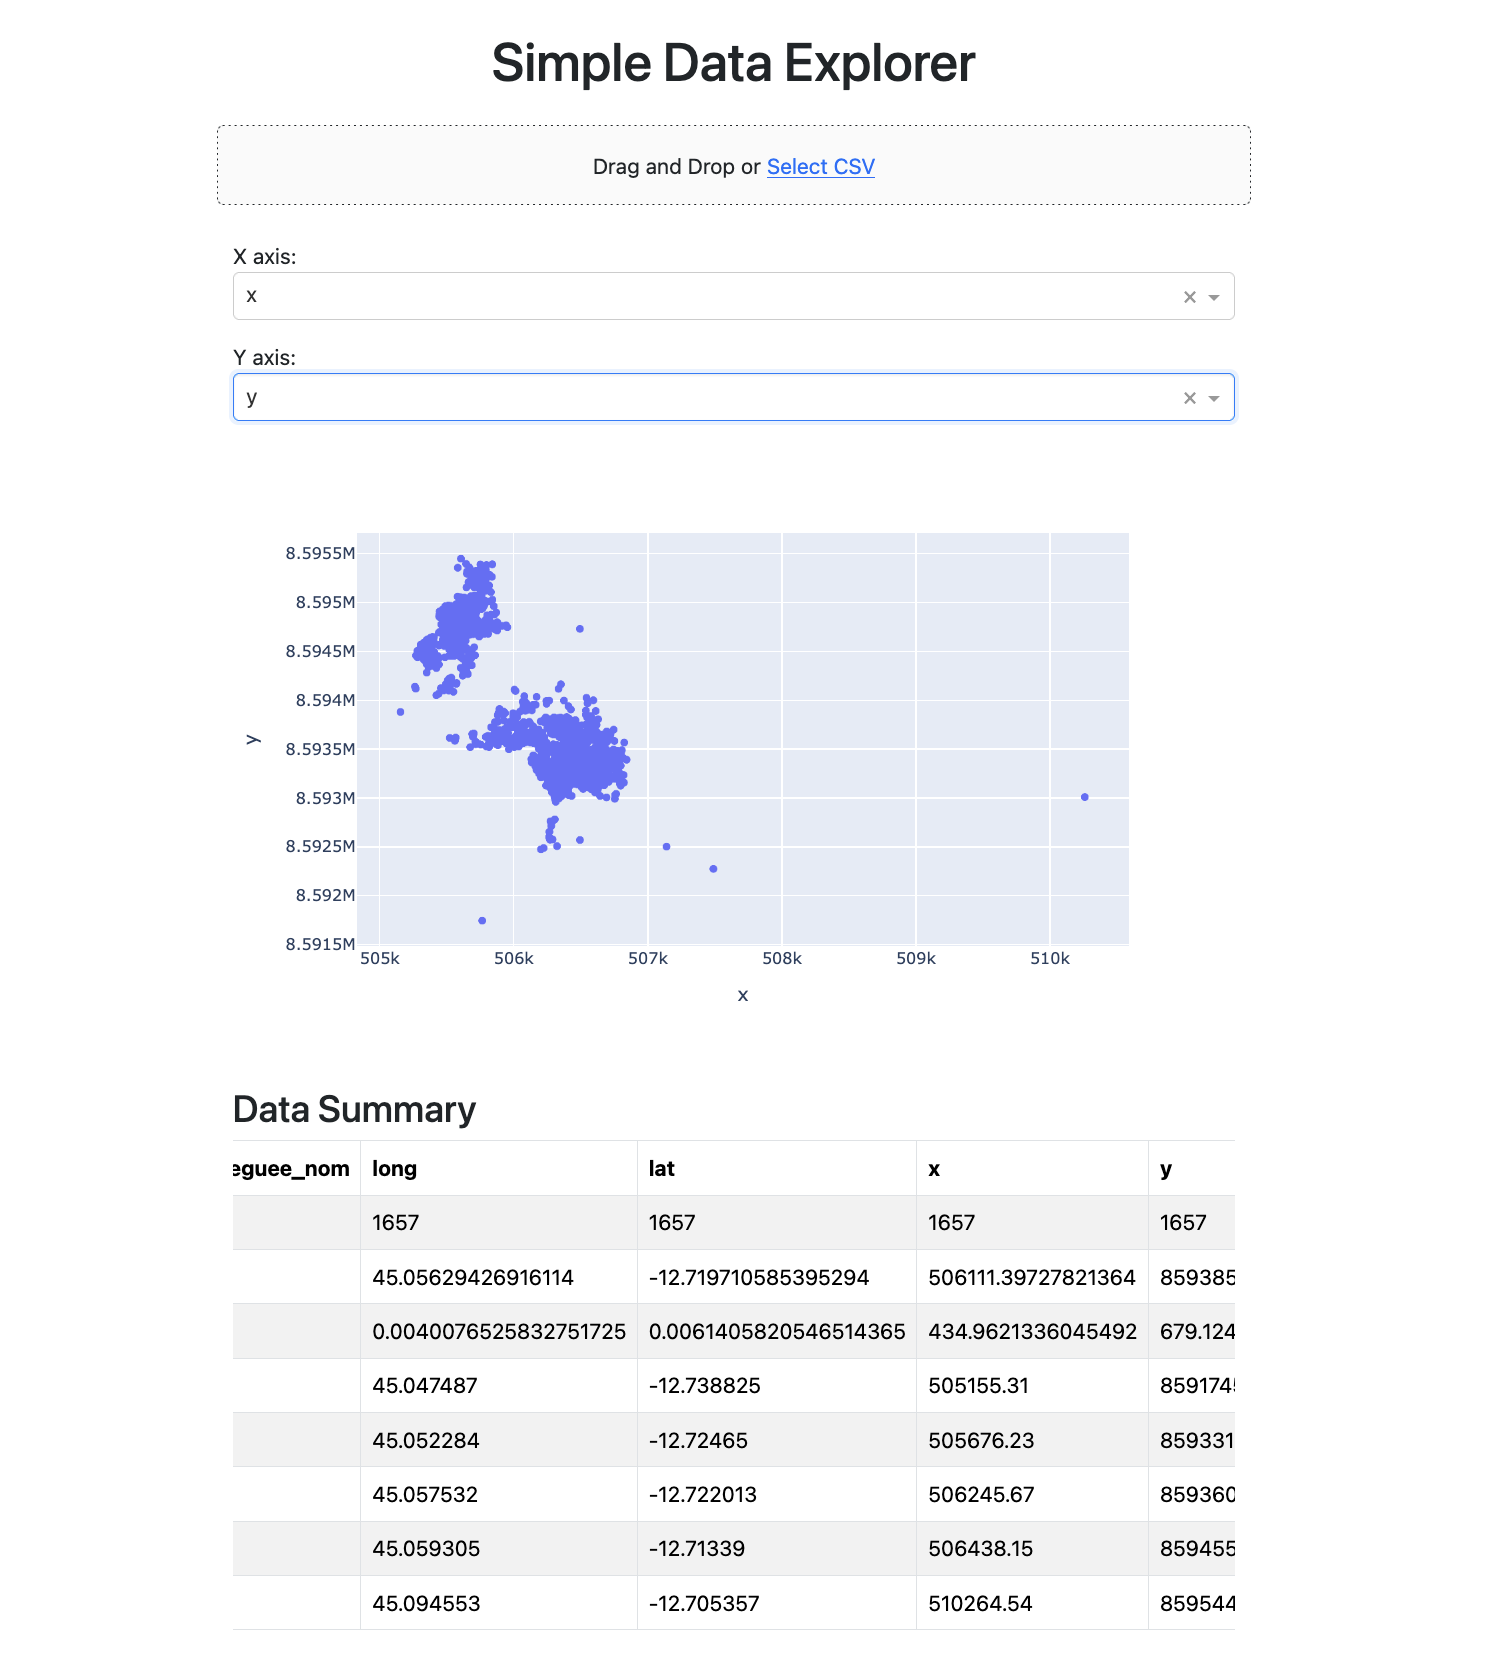
As you can see, the Dash implementation requires way more code, and more complex code. Why such a difference ?
In Dash, the components are not ‘alive’ by themselves, meaning you need to create explicit callbacks with inputs and outputs to create interactivity —which Streamlit provides automatically:
- Instead of using
st.file_uploader, we need to handle the upload of the file in a callback by reading the base64 content ; - Instead of waiting for
x_columnandy_columnto be filled and create the graph, we need to create a callback that will use them as input and create a graph as an output;
Also, styling the Dash app requires a little more effort than with Streamlit. Which can be both a good thing and a bad thing, as we’ll see later.
Where Dash is better
While Streamlit excels in simplicity, Dash is better in customizability and scalability. Let’s see why.
Customization.
Dash is much more customizable and scalable because you can fully customize how the page looks, create multi-page apps effortlessly, and specify precisely how each component interacts.
Here’s an example of what’s possible with Dash:
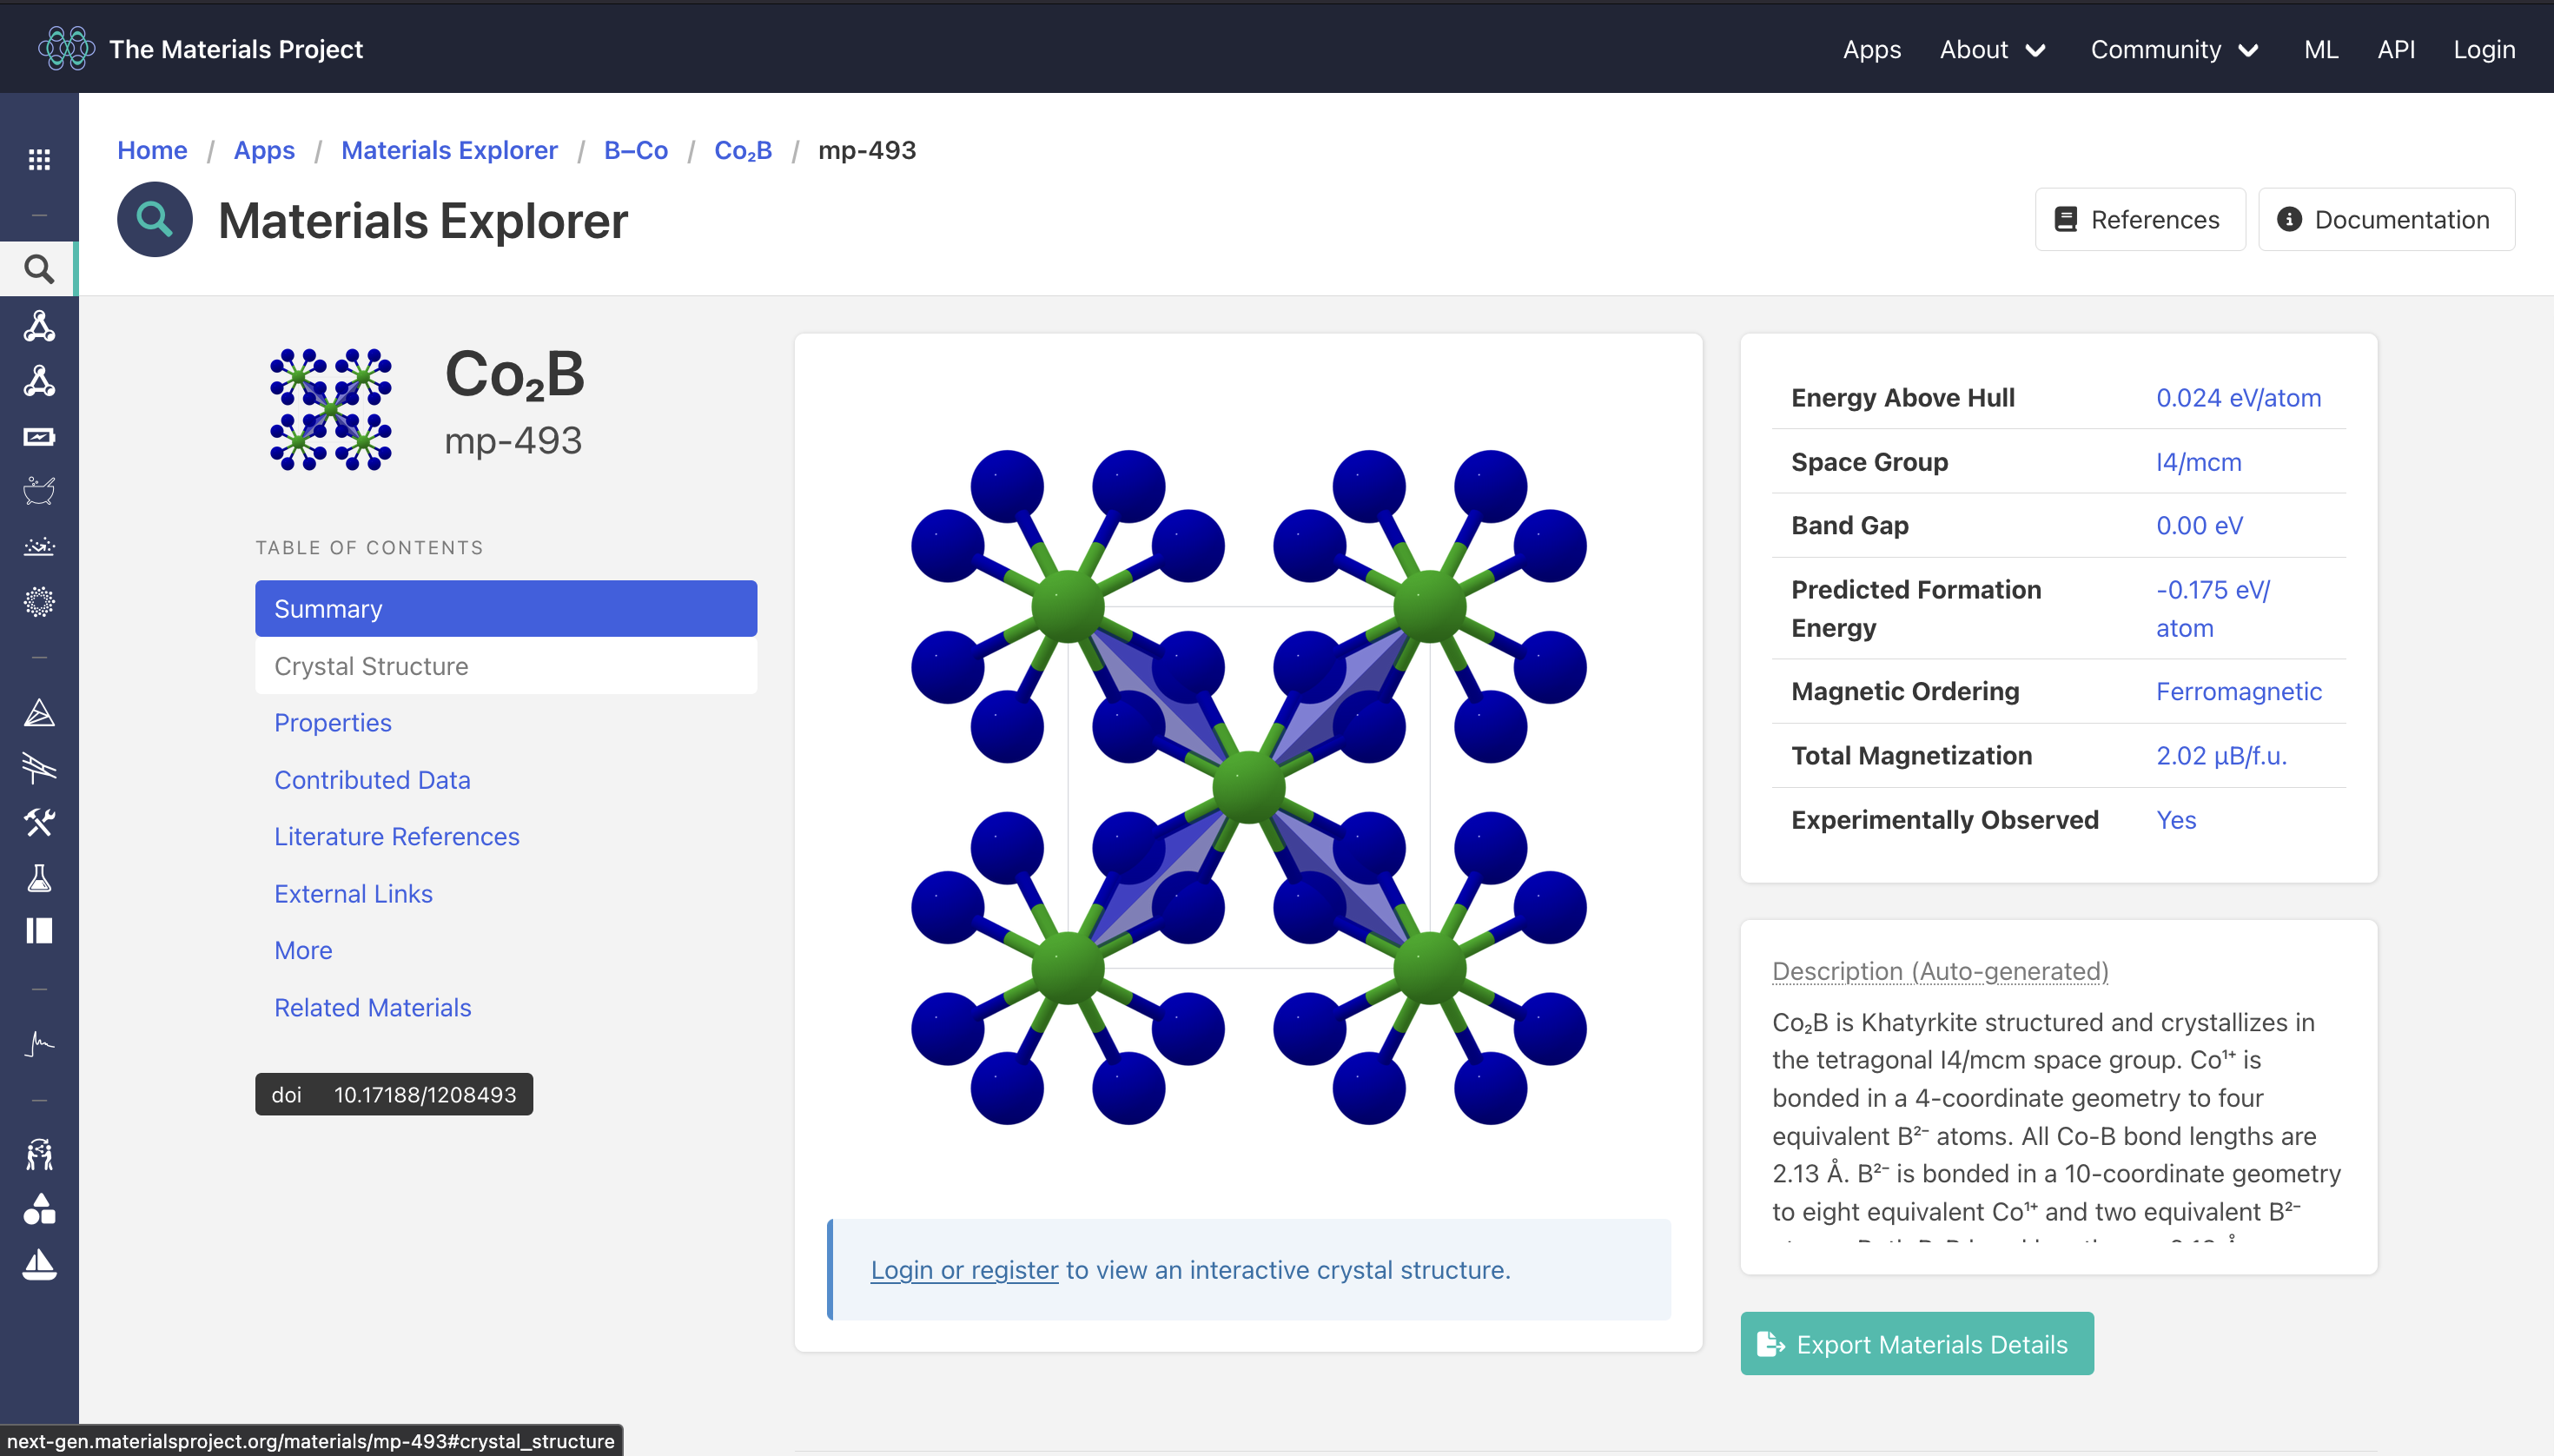
The Materials Explorer project is one of the most interesting publicly available Dash app, in my opinion. It features custom layouts, menus, popups, sidebar, visualizations and multiple pages. I encourage you to pause reading this article and explore it (but come back after!).
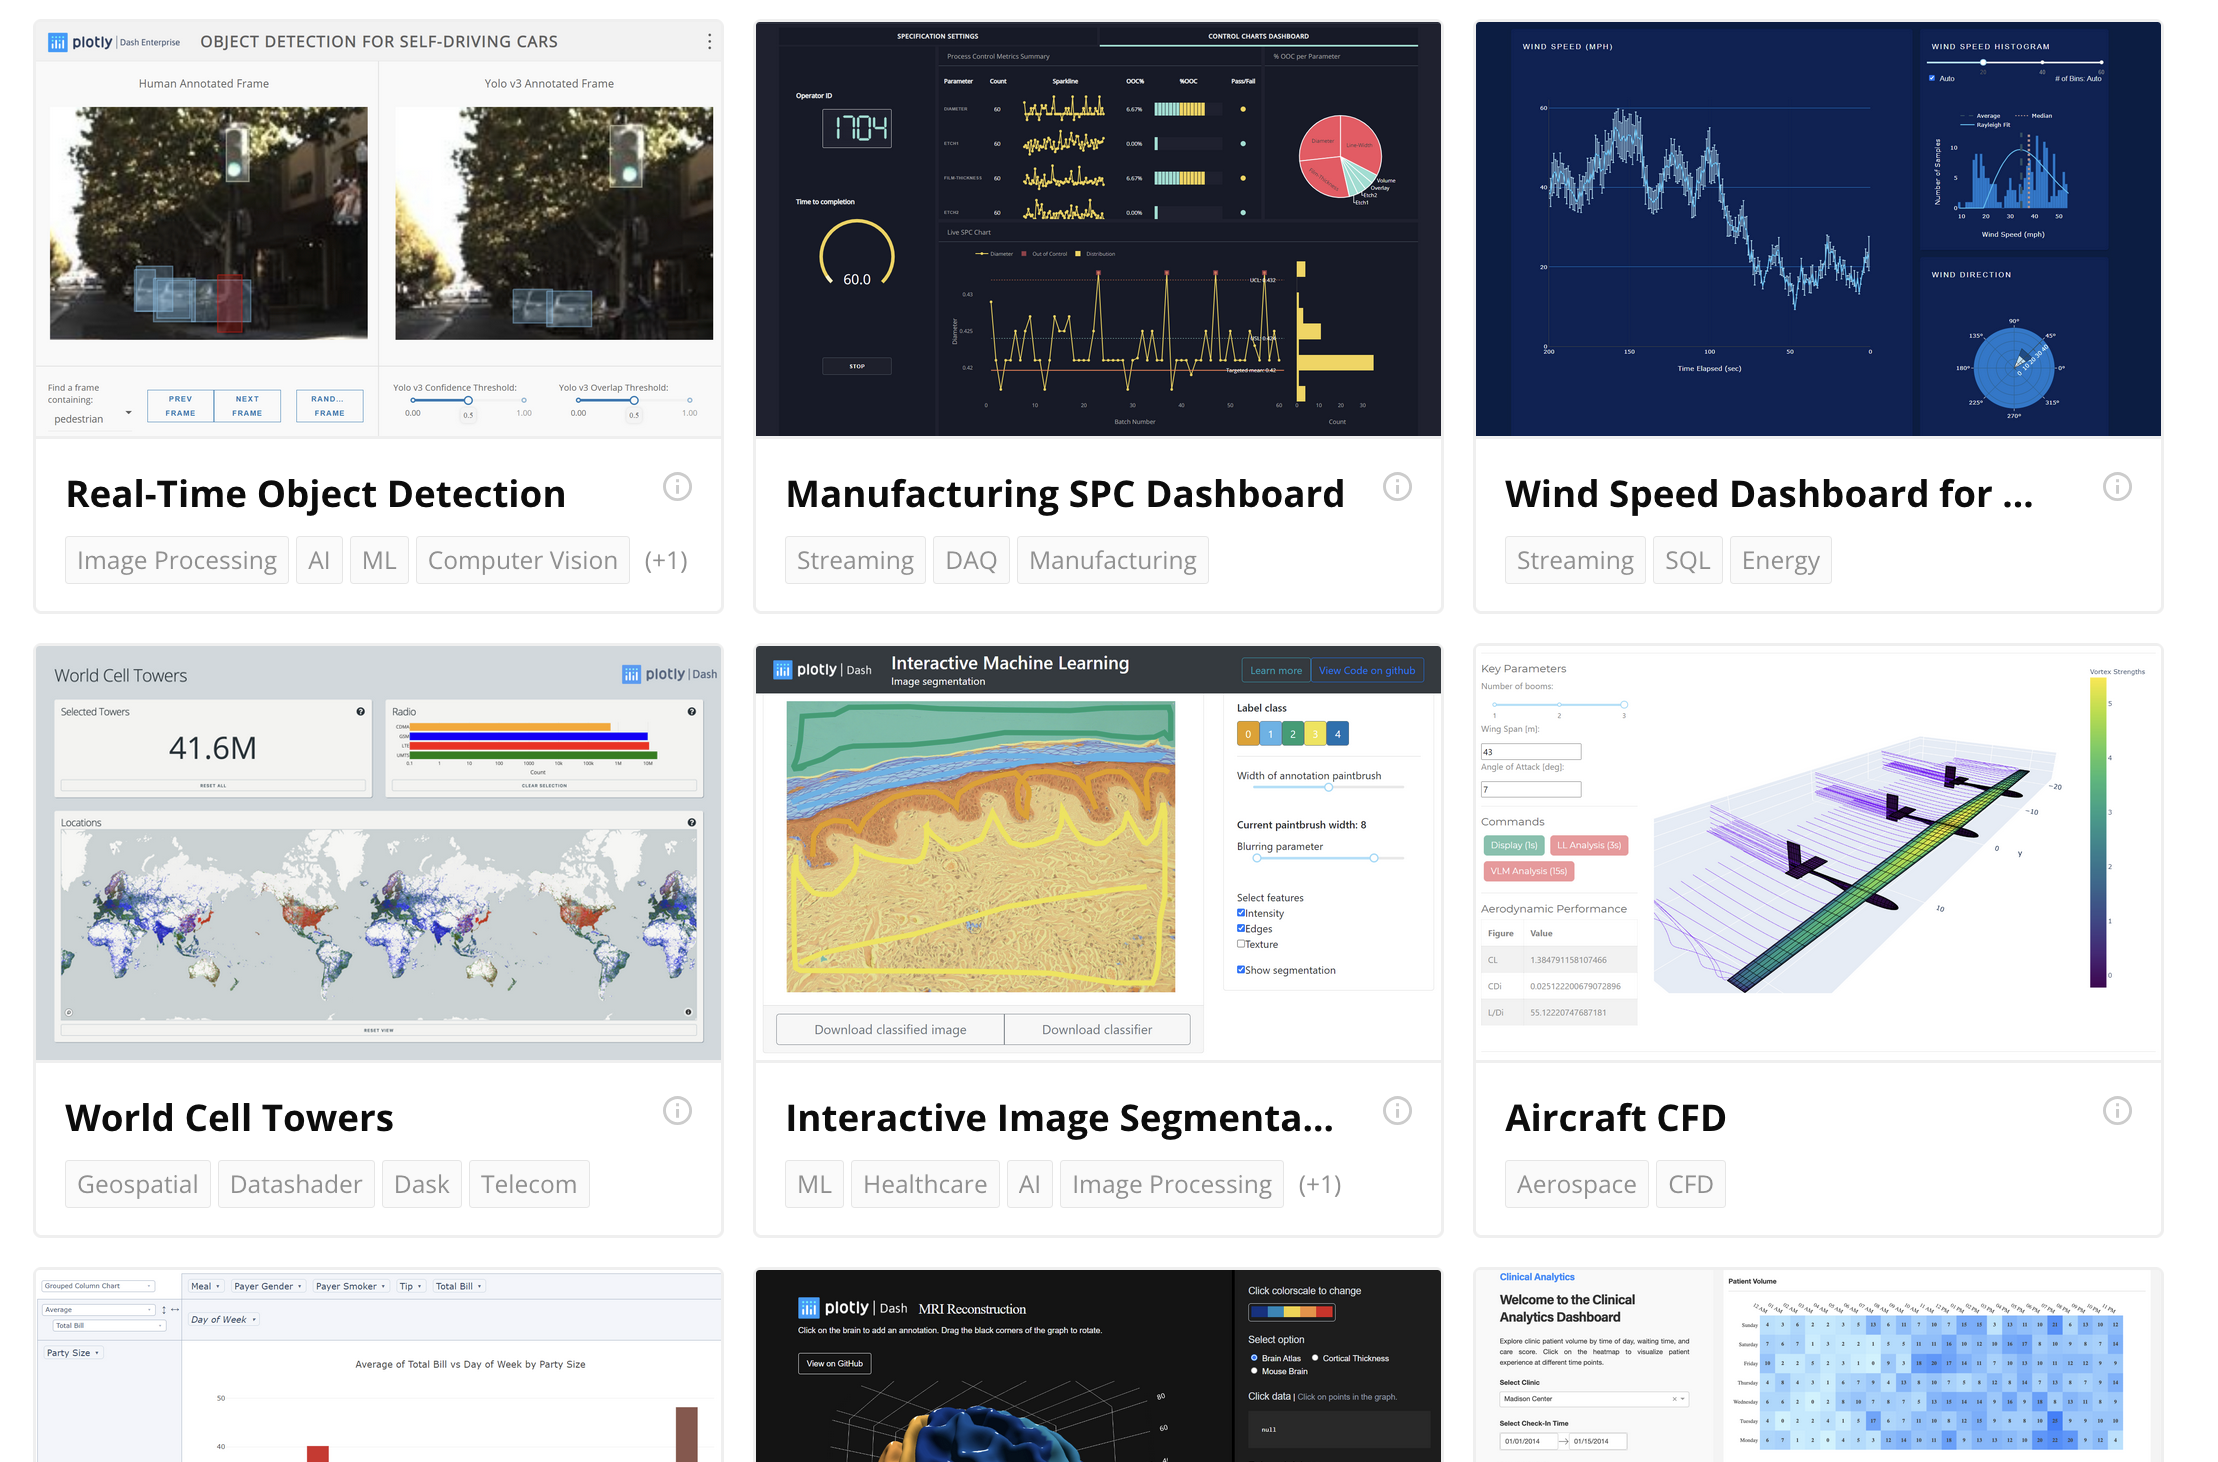
You can find many more examples of sophisticated Dash applications in this gallery and on the examples page:
Looking at the Streamlit gallery, you’ll notice that despite the variety of applications, they all follow the same visual structure and design patterns:
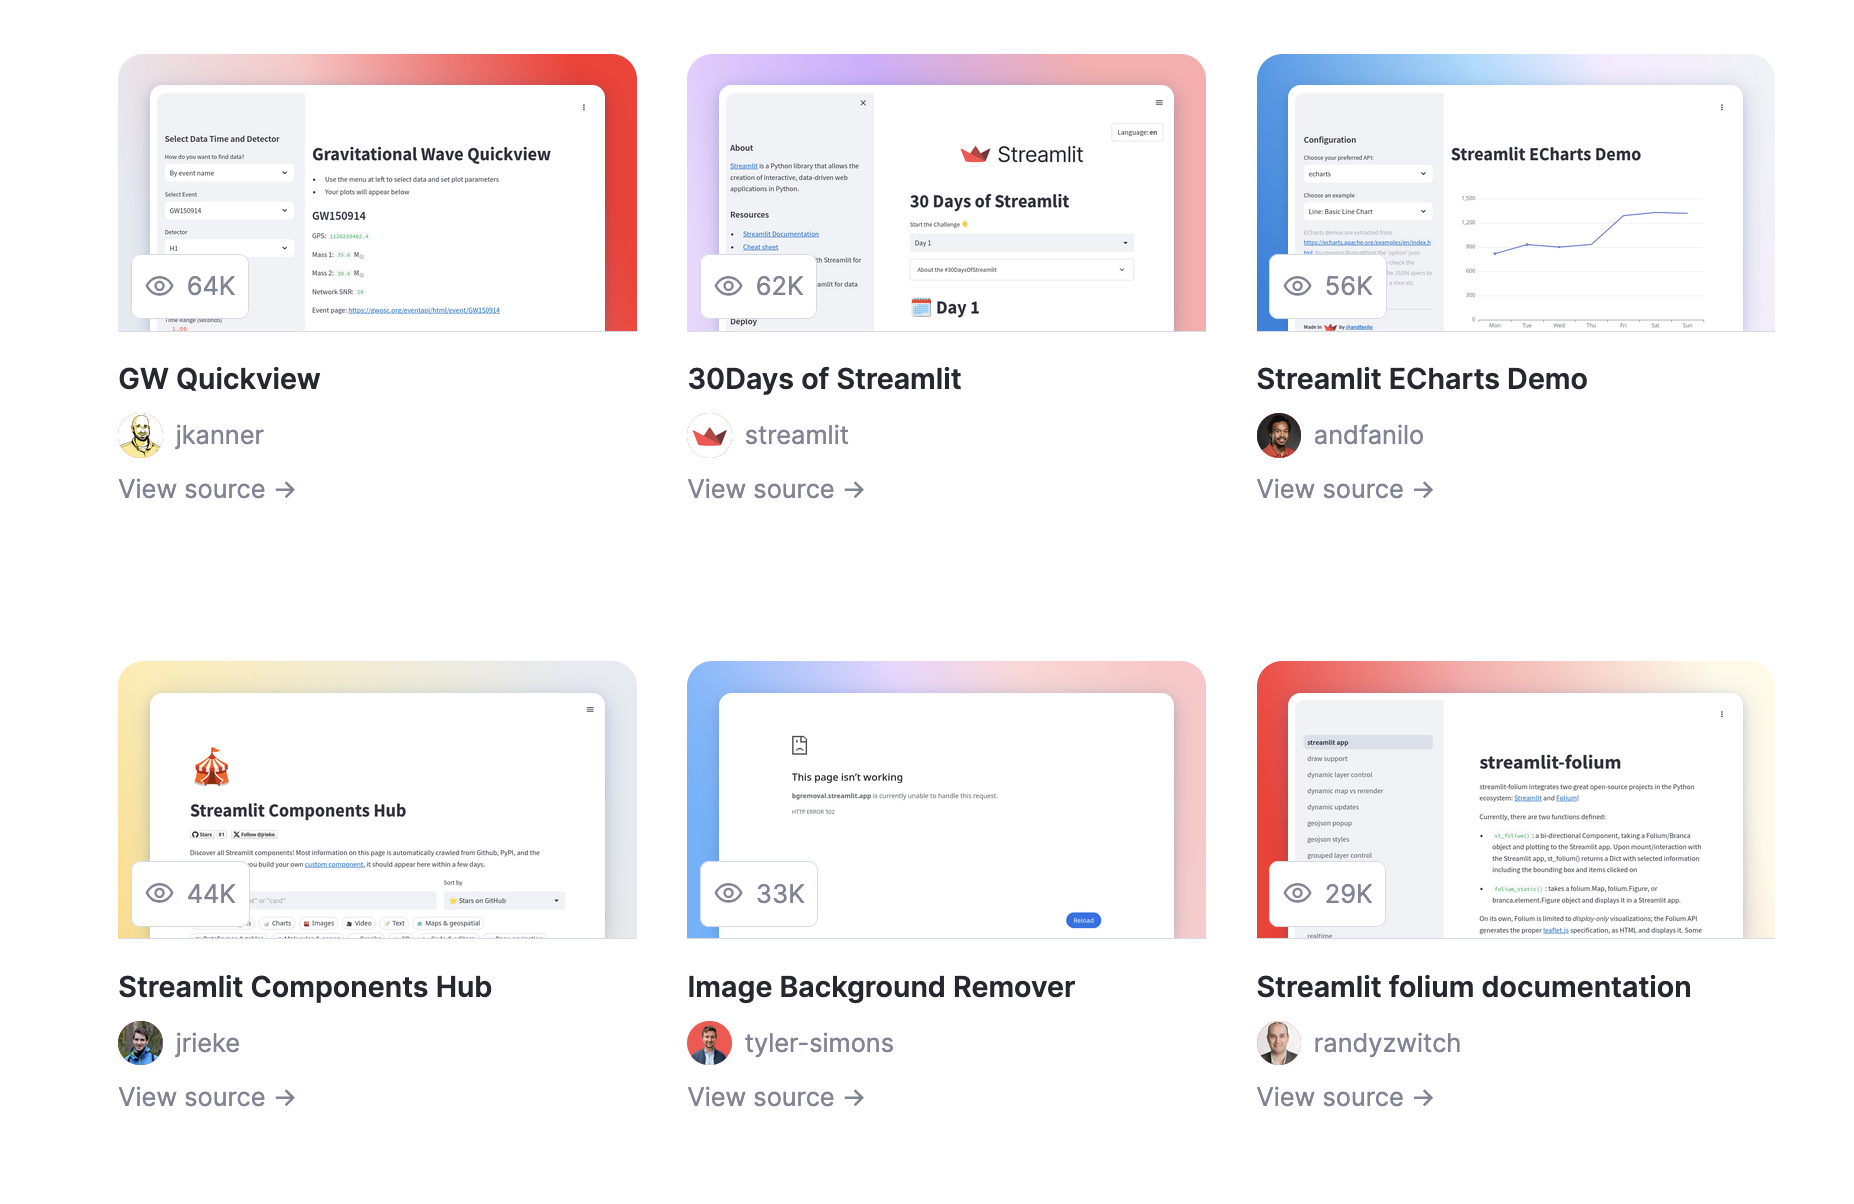
If it is possible to change a few colors, Streamlit is simply not made for high customization.
Scalability.
If your app grows, you might need more components and more interactions between them. With Dash, you can scale easily to hundreds of components and callbacks to handle interactions. Dash callbacks only update what’s necessary, providing better performance for complex applications.
Streamlit is not made the same way. When a user changes anything in Streamlit, the entire app runs again from top to bottom: a component changing at the very bottom of your app will trigger a full reload of other components, full reload of data, etc. This means developers must implement optimizations (e.g., using @st.cache_data) or the app will run slowly very quickly as it grows.
Dash plotly vs. Streamlit: table comparison
We compared each framework feature regarding how it is either built-in (✅), possible with extension (—), or needs to be implemented manually (❌).
Web Application Features
| Feature | Dash | Streamlit | Notes |
|---|---|---|---|
| Routing | ✅ | ✅ | Dash has built-in routing; Streamlit provides st.pages |
| Custom Components | ✅ | ✅ | Both support custom components |
| Authentication | — | — | Both require extensions |
| Layout Flexibility | ✅ | ❌ | Dash offers more granular control, Streamlit follows a strict top-down layout |
| Mobile Responsiveness | — | ✅ | Streamlit is responsive by default, while it’s up to you to make it with Dash. |
For web application features, Dash provides more built-in capabilities with flexible layouts, custom components, and mobile support. While both frameworks handle routing and require authentication extensions, Streamlit’s simpler structure makes it less adaptable for complex web applications requiring custom layouts.
Data Visualization & Interactivity
| Feature | Dash | Streamlit | Notes |
|---|---|---|---|
| Interactive Graphs | ✅ | ✅ | Both excellent but different approaches |
| Real-time Updates | ✅ | ✅ | Streamlit reruns entire script |
| Callback System | ✅ | ❌ | Dash’s core feature vs. Streamlit’s reactivity |
| Component State | ✅ | ✅ | Dash: per-component; Streamlit: session state |
| Custom Visualizations | ✅ | — | Dash offers more customization |
| Widget Variety | ✅ | ✅ | Both offer rich UI elements, but Streamlit offer more easy to use components like st.file_uploader |
Both frameworks excel at data visualization, but their approaches differ significantly. Dash offers more precise control over interactions through its callback system, while Streamlit provides automatic reactivity at the cost of running the entire script on each interaction.
Development & Deployment
| Feature | Dash | Streamlit | Notes |
|---|---|---|---|
| Learning Curve | — | ✅ | Streamlit is easier to learn |
| Development Speed | — | ✅ | Streamlit enables faster prototyping |
| Testing | ✅ | — | Dash has better testing infrastructure |
| Deployment Options | ✅ | ✅ | Both have cloud options, but Streamlit made it really easy. |
| Performance | ✅ | — | Dash scales better for complex apps |
| Community & Resources | ✅ | ✅ | Both have active communities |
| Integration with Data Science | ✅ | ✅ | Streamlit workflow is more notebook-like |
Streamlit is the clear winner for development speed and ease of use, making it perfect for rapid prototyping. Dash, however, offers better performance for complex applications and scales better for production use.
My personal opinion
Even if you are on “dash-resources.com“, I really tried to be as neutral as possible for this article. But you might guess that I might be biaised 😄, so here is my full opinion on this comparison.
I found that both Streamlit and Dash required similar time investment to learn the basic concepts and components. Learning the Dash API (dcc.Upload, dcc.Button, dcc.Input, …) will asked me the same effort as learning the Streamlit API (st.file_uploader, st.button, st.text_input, st.selectbox, st.slider, …). Dash callbacks are quite easy to create.
However, I quickly felt limitated with Streamlit in the way that I could customize my app interactions and layout. Dash has proven to be significantly more flexible in the long run (my SaaS is still running on Dash…).
That being said, I understand why some developers prefer Streamlit, particularly for specific use cases like ML model training and inference interfaces, where they want something that feels like a Jupyter notebook but with a user interface. For these focused applications where extensive customization isn’t needed, Streamlit’s notebook-like approach can be a good fit.
I think Streamlit is very good to build tools, and Dash is very good to build apps.
⬆️ Level up your Dash skills! ⬆️ I wrote a full course to help you learn how to think and design a Dash app with simple and advanced callbacks. Real pro-tips, from a real human expert!
Conclusion
As you now understand, the difference between these two Python frameworks isn’t about their capability — they both provide the ability to develop data science oriented applications. It is more about what you want your app to look like at the end.
At the end, the choice depends on 1) the type of data app you need to build and 2) your skill set and workflow preferences:
- Choose Streamlit if you need to build a streamlined app interface quickly. It’s perfect for people that work with notebooks and want to keep that workflow and feeling. Streamlit’s simplicity makes it ideal for data scientists who want to share their work without learning web development.
- Choose Dash if you want to create dashboards with no limits in terms of display and features. It’s perfect for people that want to build scalable apps (that can grow in time in terms of features) and SaaS data applications. Dash’s component-based architecture and callback system provide the flexibility needed for enterprise-grade applications.
I hope this article helped you better understand the differences between Dash and Streamlit! 😀
If you want to learn more about Dash plotly, you’re in the right place! We have a course and a lot of articles with examples and practical solutions. Hope to see you there ⭐